Session wise outline
Session-01: Financial Planning & Analysis
- What is Financial Intelligence?
- Accounting to FP&A
- Required skill set of Financial Intelligence
- Fintech evolution and Blockchain
- Financial organization and role define
- Design chart of accounts in AIS
- Financial data transformation
- Debit-Credit mystery in financial statement
- Conceptual framework of financial reporting
- Financial planning process & budgeting
- Accounting equation: individual to company
- Sensitivity and Worst-case scenario analysis
- Situation analysis: PESTEL and SWOT
- Homing in on cash conversion
- Forensic accounting & Internal control
- Profit first overview
Session-02: Financial KPI & Dashboard Preparation
- Understanding on KPI, KPA, KRI and Metrics
- Why business need KPI?
- How to set KPI?
- Tour on more than 40 financial KPIs
Session-03: Practical session on Microsoft Power BI
Prepare the Data
- Get data from different data sources
- Profile the data
- Clean, transform, and load the data
- Advanced query in Power query editor
Model the Data
- Design a data model
- Develop a data model
- Create measures by using DAX
- Optimize model performance
Visualize the Data
- Create reports by using visuals
- Enrich reports for usability
- Create dashboards
Analyze the Data
- Enhance reports to expose insights
- Perform analytics in Power BI
- Perform advanced analysis
- Work with AI visuals in Power BI
Manage the Data
- Create and manage workspaces
- Distribute report and dashboard
- Manage datasets
- Implement row-level security
How participants will benefit after course?
- Learning fundamental of financial planning and analysis
- How to establish financial planning process and budgetary control?
- Debit credit identification and implication in financial report
- To know financial changes in industry 4.0: fintech and Block chain
- Understanding on different financial KPIs
- Familiarization with financial dashboard and KPI reporting
- Profit first concept, forensic accounting, financial business partner, financial scenario analysis and many more exciting technics
Target audience
Any professional who involve in financial decision-making process or helps decision makers by providing real time & actionable insights. This course is suitable for them who wants to build their career in Management Information System, Financial Analysis, Business Analytics & Strategic Business Planning related functions
Instructor

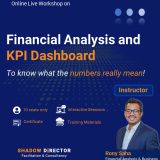
Rony Saha
Financial Analysis and Business Intelligence Professional.
Rony Saha, a Financial Management and Business Intelligence Professional with more than 10 years job experience in Accounting, Financial Analysis, Inventory Management, Business Planning, Business Process Management and Business Intelligence in different industries
To know what the numbers really mean!


Reviews
There are no reviews yet.