The Featuring benefit of using MS Power BI vs MS Excel
Power BI and Excel are both powerful tools developed by Microsoft for data analysis and visualization, but they have distinct features and purposes. Here’s a comparison highlighting the benefits of each:
MS Excel:

Familiarity: Excel has been around for decades and is widely used, so many users are already familiar with its interface and functions.
Versatility: Excel is a general-purpose tool capable of handling various tasks, from basic calculations to complex data analysis.
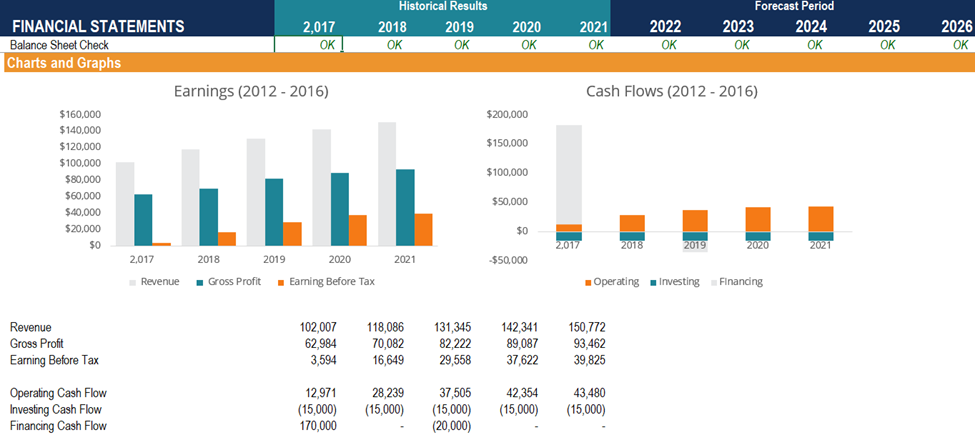
Spreadsheet Functionality: Excel is excellent for organizing and manipulating tabular data, making it suitable for smaller datasets and quick calculations.
Formula and Function Rich: Excel offers a vast array of formulas and functions, providing users with the flexibility to perform complex calculations and custom analyses.
Easy-to-Use Charts: Excel has basic charting capabilities that allow users to create simple visualizations quickly.
Offline Access: Excel is a desktop application, which means you can work with it even without an internet connection.
To learn MS Excel and its advanced functionality you can visit the Shadow Director page and their offer course Advanced MS Excel
MS Power BI:

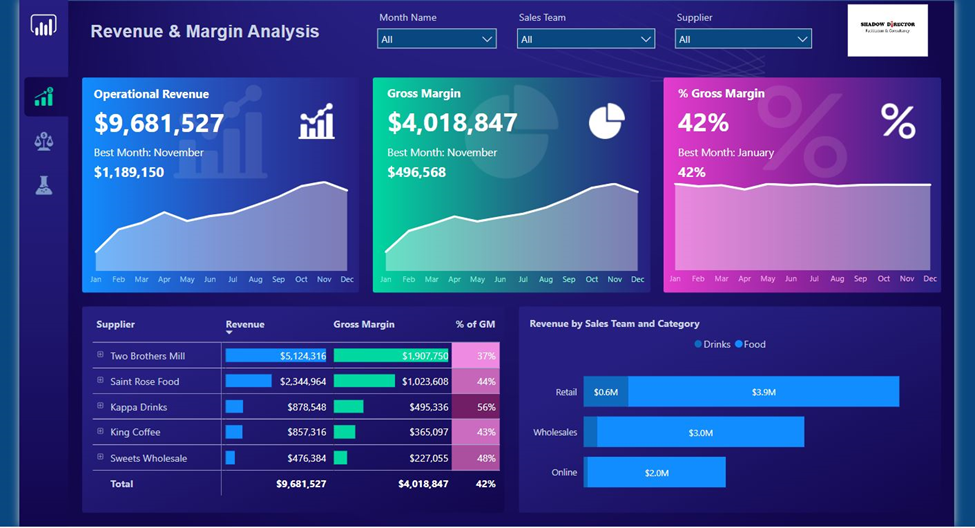
Data Visualization Focus: Power BI is primarily designed for data visualization and for creating interactive reports and dashboards.
Real-time Data Refresh: Power BI can connect to various data sources and update the reports and dashboards in real time or on a scheduled basis.
Scalability: Power BI is more suitable for handling large and complex datasets, as it can process and analyze massive amounts of data efficiently.
Data Model: Power BI uses a robust data modeling engine, allowing users to create relationships between different data sources for in-depth analysis.
Interactive Dashboards: Power BI enables users to create interactive and dynamic dashboards with drill-down and filtering options.
Online Sharing and Collaboration: Power BI reports and dashboards can be published to the cloud, making it easier to share and collaborate with others.
Integration with Other Microsoft Services: Power BI integrates well with other Microsoft services like Azure, SQL Server, SharePoint, and Teams, enhancing its capabilities further.
To learn MS Excel and its advanced functionality you can visit the Shadow Director page and their offer course Analyzing data using MS Power BI
In summary, Excel is ideal for smaller datasets, general data manipulation, and basic charting, while Power BI excels in handling large datasets, creating interactive and real-time reports, and collaborating with others online. Depending on your specific needs and the scale of your data analysis, you can choose the tool that best fits your requirements. In some cases, you might even use both tools together, with Excel for data preparation and Power BI for data visualization and sharing.