Excel for financial modeling and analysis
Excel is widely used for financial modeling and analysis due to its versatility, spreadsheet functionality, and powerful formula capabilities. Here are some reasons why Excel is a popular choice for financial professionals:
Flexible Data Manipulation: Excel allows users to organize financial data in tabular form, making it easy to input, edit, and format financial statements, transaction records, and other financial data.
Formulas and Functions: Excel offers a wide range of financial functions and mathematical formulas, such as NPV (Net Present Value), IRR (Internal Rate of Return), PV (Present Value), FV (Future Value), and more. These built-in functions facilitate complex financial calculations and modeling.
Scenario Analysis: Excel’s ability to quickly perform scenario analysis helps financial analysts assess the impact of different variables on financial projections. By changing inputs, such as sales growth rates or cost assumptions, analysts can gauge potential outcomes.
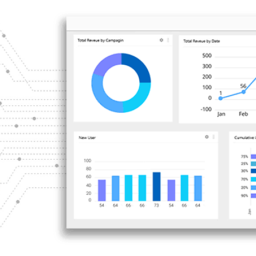
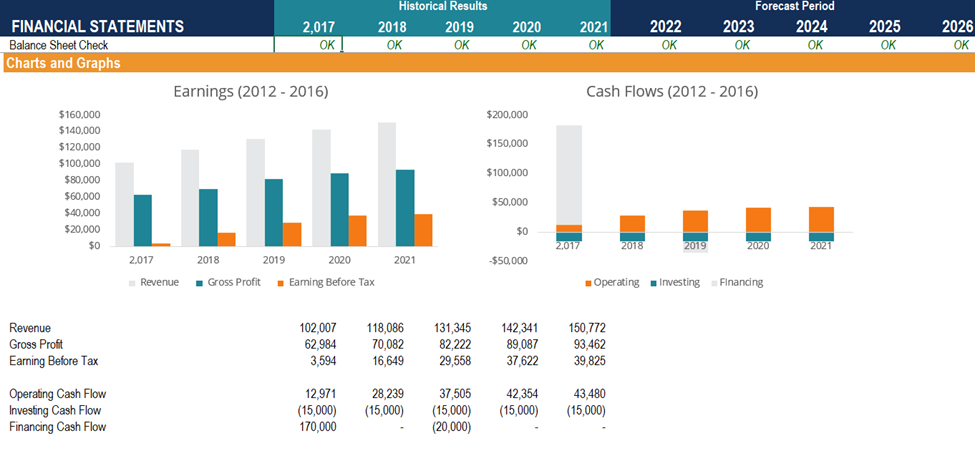
Graphs and Charts: Excel’s charting capabilities allow financial professionals to create visual representations of financial data, such as line charts, bar charts, and pie charts, which make it easier to interpret and communicate financial information.
Data Tables: Excel’s data tables enable users to perform sensitivity analysis, which shows how changes in certain variables affect financial outcomes.
PivotTables: PivotTables in Excel allow financial analysts to summarize and analyze large datasets swiftly, helping them gain insights into financial trends and patterns.
What-If Analysis: Excel’s “Goal Seek” and “Solver” tools enable financial modelers to perform what-if analysis and optimize specific financial variables to achieve desired outcomes.
Time Series Analysis: Excel has features for time series analysis, making it possible to evaluate historical financial data and detect patterns or trends.
Data Connections: Excel can connect to external data sources, such as databases, web sources, or other spreadsheets, which can be useful for retrieving real-time financial data.
Scenario Manager: This Excel tool enables users to manage and compare multiple scenarios, which is essential for decision-making processes and risk assessment.
Shadow Director offers a course to enhance your Excel usage experience on financial data modeling. To know more about this course you can visit the course outline FINANCIAL MODELING AND FORECASTING.